STOCKS 101 #7 – Financial Statements: Balance Sheet
In the last post, we started looking into the big 3 financial statements which helps investors analyse companies. In there we covered the importance of Income Statement (if you want to learn about how that works then feel free to go to that post).
Next up of the big 3 financial statements is the Balance Sheet. Similar to the previous post, we will be using our imaginary lemonade company “Sunny Sips” and create a balance sheet for it together.
In this post, you’ll learn:
- What a balance sheet is
- What data it shows and how to interpret it
- How to read a real-life balance sheet
7.1 What is a balance sheet?
A balance sheet is a document which shows how “healthy” a company is. It shows the assets and liabilities within a company. While an Income statement shows the information within a certain period, a balance sheet instead shows the information as of a certain date.
First I should introduce here the famous accounting equation:
Assets = Liabilities + Shareholders’ Equity
The reason it’s called a balance sheet is because it always balances; the assets of a company will always equal the liabilities plus the shareholders’ equity.
We will be looking at Sunny Sips balance sheet after a few months of being in business.
7.2 Assets
Let’s first look at what an asset is – an asset is anything that has value. It could be either tangible (physical things/objects) or intangible (non-physical).
For example, think of assets that you have around you – your belongings such as your phone, your car or your house (if you own it) are examples of tangible assets. You could sell them and receive money for it, therefore they have monetary value.
On the other hand, your investments (such as your stocks) are example of intangible assets, as they aren’t physical objects but similar to above you could sell them, so they are valuable!
Likewise, businesses also have assets and normally they are categorised into 2 ways – current and non-current assets. Let’s see what the difference is.
7.3 Current Assets
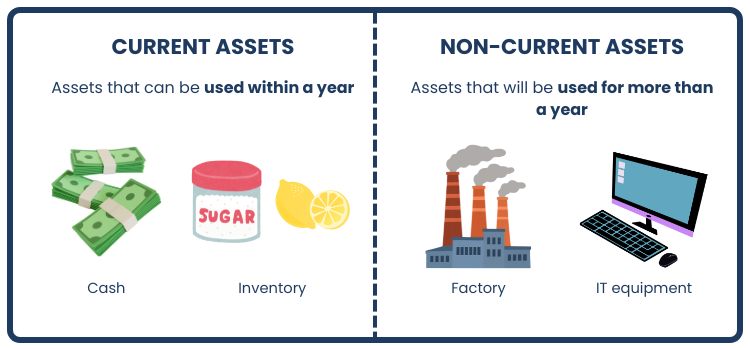
Current Assets is the first thing you will see in a balance sheet. These are the assets that can be used within a year. Using our example from before, your phone, car, and even stocks could easily be sold quickly and turned into cash; therefore these would fall under current assets.
The following are common categories of current assets that a typical business would have:
- Cash – money that the business has in a bank, which can be used right away.
For Sunny Sips, I have left some of the profits made from previous months into my bank account, to use it for the business when required. The total cash available right now is £150
- Accounts Receivable – this is any money coming in from sales, within the next year. Businesses don’t always require the money up front when making a sale – if they are selling directly to an individual customer then yes they would ask for the money when making a sale, but if they are selling to other businesses (meaning way more quantity, which would result in more revenue) then they would typically have agreement on when they would require the money to be paid by, for example within 30 days, 60 days, etc.
Sunny Sips has been in business for a while now and reviews have been good. I wanted to expand my market, so I have started offering catering service for small parties and gatherings. Last week, I catered at a birthday party, and the total cost of the service I provided was £400. I have agreed for this to be paid within the end of this month – so my current Accounts Receivable is £400
- Inventory – businesses normally keep stock of the products they sell, so that they can provide it to the customer as soon as possible, rather than wait for an order to come in and then manufacture it. Depending on the business, they may keep enough stock to cover the sales for the upcoming month, 2 months, 6 months, etc, but usually less than a year away.
Sunny Sips is a lemonade company, so I don’t need to make these lemonades days or months ahead (that probably wouldn’t be safe anyways!). However, I now do a weekly shopping of the ingredients such as lemons, sugar and cups, to cover my sales for the upcoming week. This way I don’t have to visit the shops during the week, saving me some time. The total value of these inventories are currently £50
So, the total current assets for Sunny Sips is: £150 + £400 + £50 = £600
7.4 Non-current Assets
As we have just learnt above, current assets are the ones that can be used within a year. Anything longer than this are classified as non-current assets. Using our previous examples, your home would fall under non-current assets; it’s something you’re going to use for more than a year, and if you did want to sell it, then it’s not a quick process!
Let’s look at a few common categories of non-current assets:
- Fixed assets – these are tangible assets that a business owns and they are used for business operations. Common examples are buildings they own such as offices, warehouses, factories (if the business manufactures their own products), and IT equipments (computers, laptops, etc) . Since they are used for operations, they will generally be used for more than a year, hence why they are non-current
To further develop Sunny Sips, I have recently upgraded my setup from the simple table stand that I started with, and replaced it with a custom built lemonade stand with wheels, allowing me to transport my stand wherever I want! The stand also has my business name painted on it, along with a logo, and has a built in cabinet to store my equipment. This was built by a local tradesman that I know, and it’s current value is £900. This will fall under my fixed assets
- Intangible assets – non physical assets that have value, such as patents and trademarks. Sunny Sips doesn’t have any yet, but if we ever trademarked the name or logo for example, then that would sit here on the balance sheet
The total non-current assets for Sunny Sips is £900
We will then combine the current assets with the non-current assets to get the Total Assets. Sunny Sips total asset is: £600 + £900 = £1500
Fig 1 — illustration of current and non-current assets
7.5 Liabilities
Now let’s have a look at liabilities – these are anything that you owe to someone (the opposite of an asset). Think of it as debts that need to be repaid back.
A common example that many will be familiar with is a bank loan – you request a loan from a bank, they give you the money, and later you are required to pay this amount back (usually with interest) within a given time period. Other examples are mortgages and car finances, both are debts that you need to pay back over time.
7.6 Current Liabilities
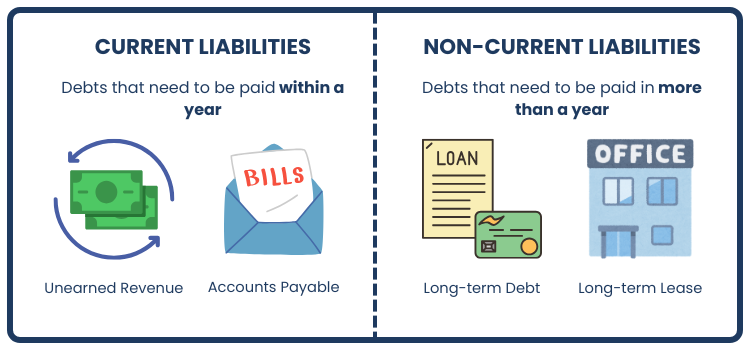
Similar to assets, liabilities are also categorised into current and non-current liabilities. Current liabilities are the debts that need to be paid within a year.
The following are common current liabilities that a business would have:
- Accounts payable – any money that is owed to a supplier (for goods/service you bought), due within the year. As explained before, businesses typically have an agreement where you buy the goods but can pay back within a specific term, such as 30 days, 60 days, etc.
For Sunny Sips, the inventory is bought directly from local supermarkets and paid for right there and then, therefore we don’t have any accounts payable.
- Short-term debts – any loans that the business has taken and is due within a year.
Sunny Sips hasn’t needed any short term loan at the moment, so this would be £0
- Unearned revenue – money that the business has received for the goods/services, but hasn’t been delivered to customer yet; this is also known as deferred revenue. For example, lets say you book a flight ticket – you pay for it right there but the flight itself is in 2 months time. For the airline, this would sit under deferred revenue, because even though they have already received the money from you, the situation may change in the future (e.g. you might cancel and ask for refund, in which case the airline would now owe you the money instead). Therefore, for them it’s considered a liability, until the flight has taken place.
As Sunny Sips is now offering catering service, a close friend has asked me to cater for his daughter’s party. Since we are good friends, he has insisted in paying the money in advance. Therefore, I have received £250 in cash up front, but the party is next month. This would be my deferred revenue, until the party has taken place.
- Unpaid wages – any money that the employee has earnt but hasn’t been paid to them yet. These are money owed to them, hence why they fall under current liabilities.
My sibling has been helping out with Sunny Sips on a weekly basis. For this month, I owe him £120, which I will need to pay him by the end of the month. This will sit under my unpaid wages.
Total current liabilities for Sunny Sips is: £250 + £120 = £370
7.7 Non-current Liabilities
Any liabilities that need to be paid after more than a year are non-current liabilities. Let’s see some examples:
- Long term debt – similar to my previous example, businesses also often take bank loans. It could be for various reasons, such as expanding the business. Normally, these will be multi-year loans, meaning they need to pay it back within several years.
As stated in my previous post, when I first started Sunny Sips, I had a £500 loan from my parents, to help start the business. They have agreed for me to pay it back within the next 2 years. I have been paying them on a monthly basis (and yes they are charging me interest too!), and I currently have £330 left to pay back.
- Long term lease – businesses will often have long term multi-year lease agreements, for example a lease on their office building, or a lease on large machinery. Sunny Sips doesn’t have any of these, so this figure is £0
Therefore, the total non-current liabilities for Sunny Sips is £330
We combine the current liabilities with the non-current liabilities to get the Total Liabilities. Sunny Sips total liabilities is: £370 + £330= £700
Fig 2 — illustration of current and non-current liabilities
The final thing in the balance sheet is the Shareholder’s equity. This is calculated by subtracting the total liabilities from the total assets. And it shows the amount of money that is returned to the shareholders if all assets were cashed out and the companies liabilities are paid off. When you look at a company’s balance sheet as an investor, you typically want to see that their assets are greater than their liabilities, because you don’t want there to be negative equity.
Sunny Sips shareholders equity is: £1500 – £700 = £800
Remember the balance sheet equation from before? Assets = Liabilities + Shareholders’ Equity For Sunny Sips, it’s the following: £1500 = £700 + £800
Now lets summarise Sunny Sips balance sheet into a table view:
| Value in £ | Description | |
|---|---|---|
| Current Assets | 600 | Assets that can be used within a year |
| Non-current Assets | 900 | Assets that will be used for more than a year |
| Total Assets | 1500 | Current + Non-current Assets |
| Current Liabilities | 370 | Liabilities due within a year |
| Non-current Liabilities | 330 | Liabilities due in more than a year |
| Total Liabilities | 700 | Current + Non-current Liabilities |
| Shareholders Equity | 800 | Total Assets – Total Liabilities |
7.9 Real life balance sheet
Now that we have learnt how the balance sheet works, let’s look at an actual real life example and go through it. We will be looking at the balance sheet of Microsoft, one of the largest companies in the world, for their fiscal year of 2025. These figures are taken directly from Microsoft — *Note: public companies in the U.S have to release their financial documents every quarter known as “Earnings report” which are available to the public (usually via their websites), and the balance sheet is one of the core documents within it.
Assets
Current Assets
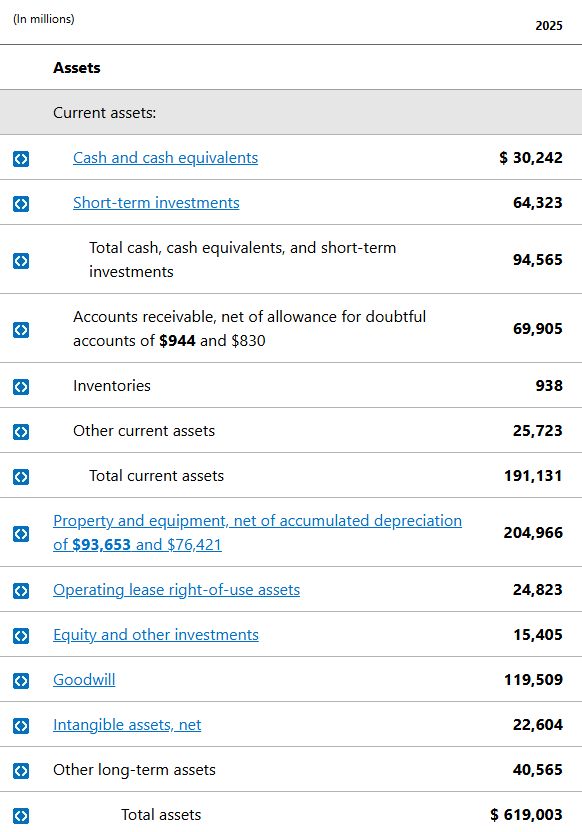
The first thing you will see on their balance sheet is the current assets, which has its own sub-heading. They have total cash, cash equivalents, and short term investments (*these can be easily converted to cash) of around $95 billion (quite a bit more than Sunny Sips!)
This is followed by the rest of current assets which we have covered in this post – accounts receivable, inventory and other current assets. Their total current assets is around $191 billion
Non-Current Assets
After the total current assets line, they are showing their non-current assets (*they haven’t included a sub-heading for these). It starts with the “Property and equipment” line which is basically referring to their fixed assets. Then there are a few other non-current assets that we haven’t covered before (remember, every business is unique so they will have their own categories of assets and liabilities) – one of them is Goodwill which represents extra value a company has due to things such as strong brand name and customer loyalty.
Then finally they show their total assets which is around $619 billion – this just shows how giant of a company they are!
Liabilities
Current Liabilities
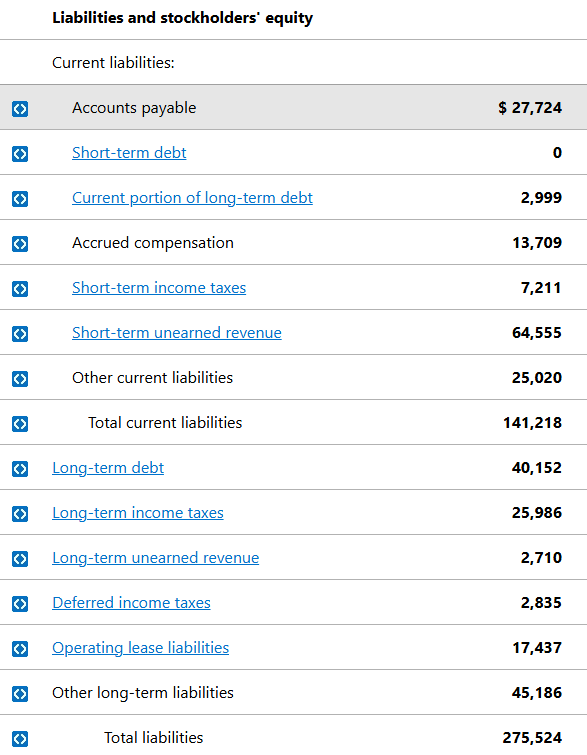
They start off by showing their current liabilities , which has its own sub-heading. They show things we have covered such as accounts payable, short term debt and unearned revenue; there are also a few other current liability categories that we haven’t covered before, e.g. “accrued compensation”. Then they show the total current liabilities, which is around $141 billion.
Non-current liabilities
Following on, the next lines show their non-current liabilities. It includes ones we have covered such as long term debt and long term unearned revenue, and there are a few others we haven’t covered.
Final line shows their total liabilities of around $275 billion.
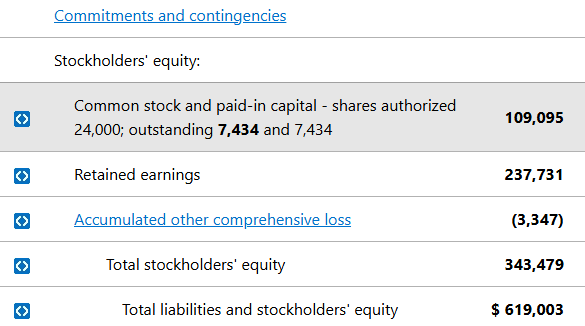
The final section of their balance sheet shows their Shareholders equity, which is their total assets minus the total liabilities, which equates to around $343 billion (*I know there are other lines that they have shown like “common stock and paid-in capital” and “retained earnings” – these are just the equity split into separate categories). This positive equity shows that Microsoft has more than enough assets to cover their entire liabilities, which is a sign that every investor wishes to see in the companies they invest in.
And that’s the end of Balance Sheets! Hope this post helped you understand how they work and helps you with your stock analysis. Similar to my previous post, this post is also quite a hefty topic to take in, but the more balance sheets you go through, the easier they become to read!
Next up in the “Stocks 101” series, we’ll look at the last of the big 3 financial statements — Cash Flow Statement. See you there!
As always, if you have any questions, feel free to drop them in the comments below.