Stocks 101 #6 – Financial Statements: Income Statement
By now, you’ve learnt what the stock market is and how it works — but how do you actually choose which stocks to buy? The choice of stocks available within the market is endless. There is no right or wrong answer, but what we can do is analyse individual stocks to determine whether they would be a good fit for your portfolio. In the first part of the series, we covered the fundamentals of the stock market (if you’re new to investing, then I suggest starting there). In this second part, we will go over the different ways that investors analyse stocks. We will start off by looking at the big 3 financial statements — these are the core financial documents generated by a company which provide key insights.
I’ll be honest, when I first came across these statements back when I started investing, I wasn’t really thrilled to go through them. If you go and have a look at an actual example of one of them right now, you’ll be faced with lines after lines of massive numbers alongside lots of complicated “finance” words — and since I wasn’t from a finance background, most of what I read made no sense at all! But once I did learn them (after going through several YouTube videos…) , I started seeing the benefits, because understanding them greatly helped me make up my mind about that company.
So, in these upcoming posts, I will be breaking these statements down into pieces. To make things easy, we will create an imaginary company and we will create the 3 statements for it together. We’ll go with a classic business that everyone is aware of — a lemonade stand.
Our company will be called “Sunny Sips” and we will have a very simple setup – a table with a jar full of homemade lemonade, along with cups for our customers. Now that we have the business setup, let’s look at the first of the 3 statements: Income Statement
In this post, you’ll learn:
- What an income statement is
- What data it shows and how to interpret it
- How to read a real-life income statement
6.1 What is an income statement?
The income statement (often referred to as “Profit & Loss Statement” or simply “P&L”) is a document showing the company’s financial performance over a certain period (most commonly every quarter).
For our example, we will build our statement for just the week.
6.2 Revenue (Sales)
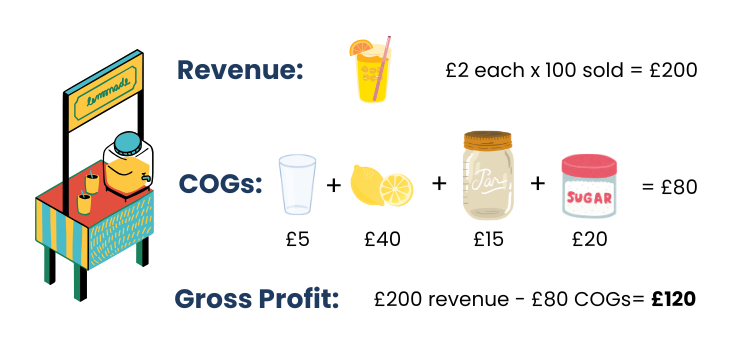
The Income statement begins with the Revenue (or Sales) — this is how much money we have earnt from the business within that period. In our case, it’s how much money we’ve made from selling our lemonade. Let’s keep it simple and say we sell the lemonade for £2 each, and over the week we have sold 100 cups for a total revenue of £200 (not bad for the first week for Sunny Sips!)
For most companies, they will have different streams of revenue, e.g. they might sell products via different methods such as online website and also via a physical store. Therefore, companies will usually split this revenue section by the different revenue streams. Revenue streams will vary a lot depending on the type of business and what they sell.
6.3 Cost of Goods (COGs/cost of sales)
It’s great that we’ve made decent sales, but now we have to check how much it actually cost us to earn that much of revenue – this is known as “Cost of goods” (or simply referred to as COGs). So for all of the cups of lemonade we sold in that week, we need to calculate the cost, such as the ingredients used to make those lemonades.
We’ll assume the costs as the following:
- 100 Plastic cups = £5
- Lemons = £40
- Glass Jar = £15
- Sugar = £20
- Water = free from the kitchen!
The total cost for this week is £80
COGs will vary depending on the type of business — a company that sells physical goods tend to have higher COGs compared to ones that sell non-physical goods. For example, lets look at Ford — they sells cars so their costs will include things such as the material required to make the cars in the factory. Let’s compare them to Microsoft who sells software – if a new customer wants to buy Microsoft Office, Microsoft doesn’t have to build the software from scratch (it has already been built!) so their costs will be very low.
Similar to revenue, companies will normally split the COGs by different categories.
6.4 Gross Profit
Now that we know what our total revenue was, and how much the COGs are, we can calculate the gross profit by subtracting the COGs from the revenue.
Our total gross profit for the week: £200 – £80 = £120
Fig 1 — illustration of Gross Profit calculation
Gross profit is used to calculate the Gross margin (*shows the profit as a percentage) using this formula:
- Gross Margin = (Gross Profit / Revenue) x 100
Using above formula, we can calculate Sunny Sips’ gross margin as: (120/200) x 100 = 60%
For the previous mentioned companies, their gross margins for 2025 were the following:
- Ford = 5.8%
- Microsoft = 68.82%
6.5 Expenses (overheads)
The next thing that comes up in an income statement is to account for any expenses (or overheads) that may have occurred while operating the business for that period. There can be lots of different types of expense, but the most common ones would be admin costs (such as salary paid to employees), rent (if the company owns any offices or retail stores), marketing spend (money spent on advertising), and IT costs (laptops, mobile phones, software, etc).
For Sunny Sips, we are just selling it from our front garden, so we luckily don’t have any rent to pay. As for employees, let’s say I asked my sibling to help out with operating the lemonade stand, and for this I agreed to pay him £30 weekly. I also thought it would be a good idea to print out some leaflets about the business and distribute it around town to market our business — cost for this was £20.
Therefore the total expenses for this week will be £50.
6.6 Operating Profit
We can now calculate our operating profit by subtracting the expenses from our Gross Profit. For Sunny Sips, our operating profit is £120 – £50 = £70
Operating profit is a key metric that investors take keen interest in when analysing stocks, as it shows how much money your business makes from day-to-day operations.
Operating profit is used to calculate Operating Margin (profit shown as percentage) using the following formula:
- Operating Margin = (Operating Profit / Revenue) x 100
This operating margin shows how efficiently the business is running.
Sunny Sips operating margin is: (70/200) x 100 = 35%
6.7 Non-Operating Expenses
Business can also incur other expenses that are unrelated to the day-to-day operations, therefore they are separated out into a separate section within the income statement. Most common examples of these are interest expense (if the business takes out a loan and has to pay back interest on it), business write offs (such as if goods have been damaged/stolen), and foreign exchange gains/losses (if the business sells goods worldwide, then there will be foreign exchange gains or loss depending on the currency exchange rates).
To start Sunny Sips, I initially borrowed £500 from my parents to start the business, and the weekly interest I have to pay back on this loan is £5 (I know it’s unrealistic but this is just for the sake of it!). And on the second day, I accidentally knocked over the lemonade jar and spilled it all, so it all went to waste and I had to go re-buy the ingredient. I would estimate this damaged goods around £20
So, our total non-operating expense is £25.
6.8 Income before tax
Now, we just need to subtract the non-operating expense from the operating profit and what we are left with is the Income before tax (this is quite self-explanatory!)
Sunny Sips income before tax is: £70 – £25 = £45
6.9 Tax
The very last thing to account for within the income statement is the tax that the business needs to pay. This will vary depending on the business and the country they operate in — for e.g. in the UK, right now the corporation tax is 25%.
Since Sunny Sips is a small business and the revenue isn’t a lot, there is no tax for us to pay at the moment. Once our revenue starts ramping up, then we will need to worry about it!
6.10 Net Income (Profit)
Finally, we subtract the tax and what we end up with is the Net Income (or commonly referred to as simply Profit). This is the money that the company keeps from the revenue after deducting all costs and expenses.
Our Sunny Sips has made a total profit of £45 for the week!
Net Income is used to calculate the Net Income Margin (profit margin) using the formula:
- Net Income Margin = (Net Income / Revenue ) x 100
This is arguably the most important metric that investors look for in the income statement when analysing stocks (it certainly is for me!).
Sunny Sips has a net income margin of: (£45 / £200) x 100 = 22.5%
*Note: if a company has a negative net income (i.e. when the total expenses are greater than the revenue made), then they have made a “Net Loss” for that period.
Now lets summarise Sunny Sips income statement into a table view:
| Value in £ | How to calculate? | |
|---|---|---|
| Revenue | 200 | |
| COGs | 80 | |
| Gross Profit | 120 | Revenue – COGs |
| Expenses | 50 | |
| Operating Profit | 70 | Gross Profit – Expenses |
| Non-Operating Expense | 25 | |
| Income Before Tax | 45 | Operating Profit – Non Operating Expense |
| Tax | 0 | |
| Net Income (Profit) | 45 | Income Before Tax – Tax |
Great, we have now created our first income statement for our business!
*note: if you hear people say “top line” then they are referring to the Revenue, and if they say “bottom line” then they mean the Net Income — it’s referred to as such due to where they appear within the income statement
Now that we have learnt how the income statement works, let’s look at an actual real life example and go through it. We will be looking at the P&L of Microsoft, one of the largest companies in the world, for their fiscal year of 2025. These figures are taken directly from Microsoft — *Note: public companies in the U.S have to release their financial documents every quarter known as “Earnings report” which are available to the public (usually via their websites), and the income statement is one of the core documents within it. I’ve picked Microsoft because you might think that their statements will be a complicated document since they are such a massive company, but as you’ll see, it’s actually quite straight forward!
Revenue and COGs:
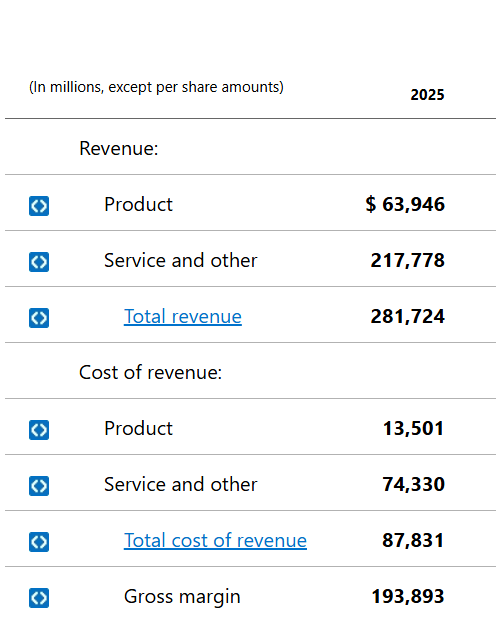
- Let’s look at their revenue first. Microsoft have split it into 2 streams — products (for their physical goods such as laptops) and services (for their non-physical goods such as their software).
- Now scroll down to their their COGs (which they refer to as “Cost of revenue”) and you’ll see that they have also separated this into the same categories — so for instance, to generate their products revenue of $63.9 billion, it cost Microsoft $13.5 billion to make those products.
- They have also added a line each for the total revenue and total costs. And finally they have shown the gross profit (*although they have written it as “Gross margin” – companies sometimes use the terms interchangeably, even though as we learnt earlier, profit is the figure and margin is a percentage) which is the total revenue minus the cost.
Expenses and other costs:
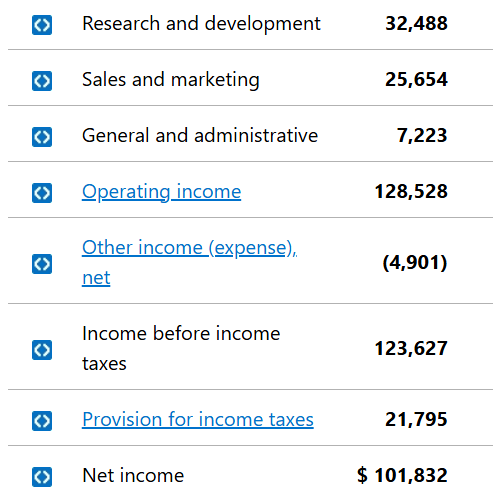
- Let’s look into their expenses. They haven’t added a heading for expenses, but we can see that they have split the expenses into 3 categories:
- Research and development – many companies (especially those in the technology industry) will spend a lot of their money on researching new things, in order to improve their existing products or invent new ones.
- Sales and marketing – this will involve all the advertising they pay for, and any cost involved with getting sales from customers (such as product demos)
- General and administrative – this will normally include costs such as employee salaries, rent, and IT equipment
- The next line they show is the Operating income which is their “Gross margin” line minus the 3 expenses lines
- They have a line called “Other income (expense), net” — often a negative value within the P&L is shown within brackets, so this line basically means if the figure is not in a bracket then it’s other income, but if it is inside a bracket then it is other expense. In this case they have 4.9 billion of other expense (this is basically what we referred to earlier as Non-operating expense)
- Finally, they show their income before tax (which is their operating income minus the other expense), followed by the tax, which is further subtracted to give a final Net income figure of $101.8 billion. Using these figures we can calculate their Net Income margin as: ($101.8 billion / 281.7 billion) x 100 =36.1% . As you can see they are profit making machine!
As mentioned in the beginning of the post, income statement shows the performance within a certain period — for most US public companies, they will show their income statement per every quarter, and one for the full year. Along with the figures for that period, companies will also generally include the performance of previous period or year, and the difference between then and now — e.g. they might compare this period vs last period, or this year vs last year. Including these helps investors analyse how the company has been performing; what investors like to see is a growth in revenue and profit, rather than a decline.
And that’s a wrap on income statements. Hope this post helped you understand how they work and why it’s useful for stock analysis. It is quite a hefty topic to take in (trust me, it took me quite a while to get my head around it), but once you understand the basic structure, they become much easier to read. I would encourage you to go and have a look at some income statements of any companies you’re interested in so that it starts getting more familiar. Do beware, some companies release very detailed income statements, which are quite challenging to read!
Next up in the “Stocks 101” series, we’ll look at the second of the big 3 financial statements — Balance sheet. See you there!
As always, if you have any questions, feel free to drop them in the comments below.